Amazon EC2 + CloudWatch + New Relic: Monitoring, Alert Notifications
We have been on Ec2 for almost two years but recently, we needed to monitor a few stuffs on server so we did a bit of experiences on that and deployed it a couple of months back. We found that we had a pretty good result so I am going to share it here as usual.
Purpose
To monitor the following things on Amazon Ec2 virtual machine and send the alerts based on some conditions.
- CPU Utilization
- Memory Available
- Disk Space Available
- Network
- VM Status
Methods of monitoring
There are a few ways to monitor the instances of EC2 but we chose to use Amazon CloudWatch and New Relic.
- Cloud Watch
- New Relic
Amazon Cloud Watch
The reason is simple. We chose it because Amazon provides it. There is no cost for monitoring some basic stuffs ([Amazon CloudWatch Pricing][1]) so it fits us well.
Basic Monitoring metrics (at five-minute frequency) for Amazon EC2 instances are free of charge, as are all metrics for Amazon EBS volumes, Elastic Load Balancers, and Amazon RDS DB instances.
New and existing customers also receive 10 metrics (applicable to Detailed Monitoring for Amazon EC2 instances or Custom Metrics), 10 alarms, and 1 million API requests each month at no additional charge.
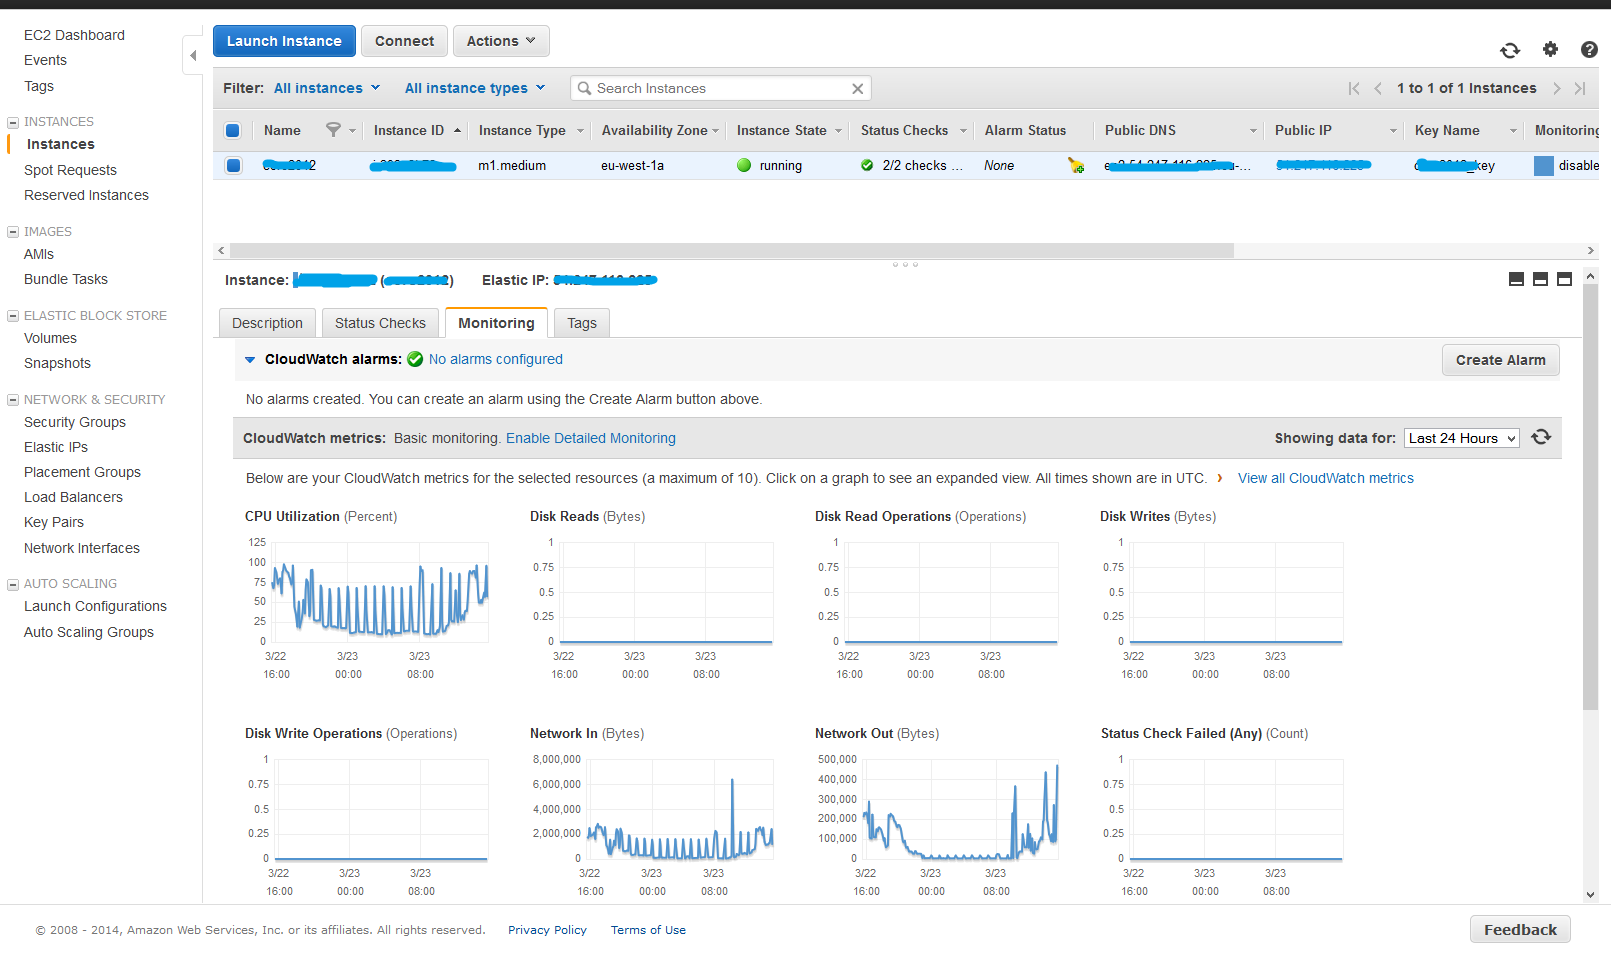
Amazon EC2 Console – Default Monitoring
This is what you will see when you open up the EC2 console. You can enable the monitoring and create the alarms in this console as well.
CloudWatch – Monitoring
Once you have enabled the default monitoring in EC2 console, you will see the following metrics in CloudWatch console.
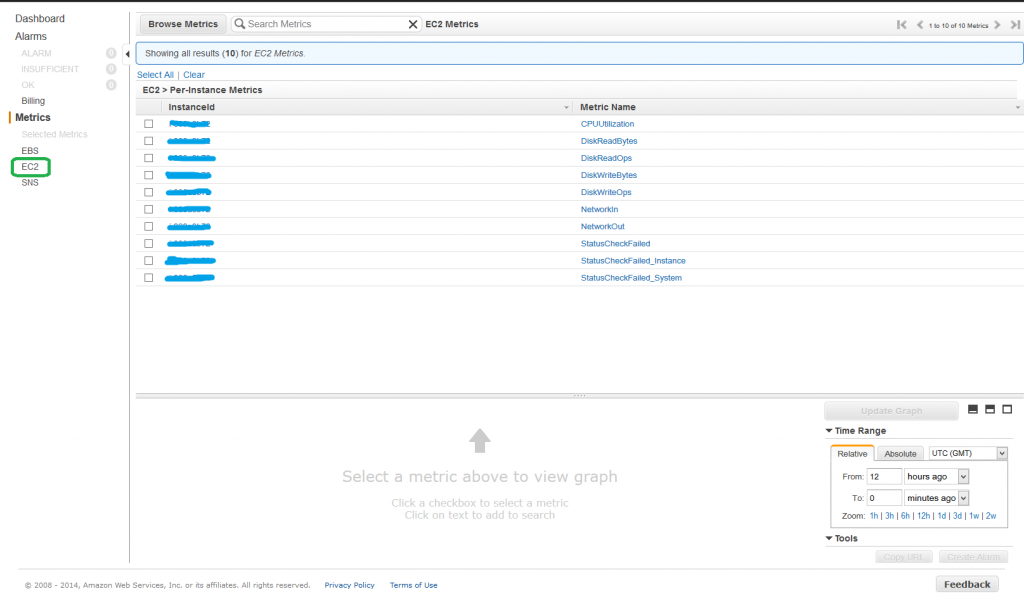
Of course, this is not what we need. We need to monitor the disk space, memory utilization and etc. So we need to create some custom scripts for that.
AWS SDK for .NET
“AWS SDK for .NET” allows you to create the scripts that can create the custom metric on CloudWatch. You can download the SDK from this link. We want to monitor the disk space and memory which doesn’t include in EC2 default monitoring so we need to install this SDK and create the script for that.
Amazon CloudWatch Monitoring Scripts for Microsoft Windows Server
You can roll your own script for monitoring what you want to monitor but it’s always a good idea to google before creating your own because if your requirements is very common then someone might be already created the script for that.
I found a brunch of monitoring scripts from this link. This package includes the scripts for the following metrics.
- Memory Utilization (%)
- Memory Used (MB)
- Memory Available (MB)
- Page File Utilization (%)
- Page File used (MB)
- Page File available (MB)
- Disk Space Utilization (%)
- Disk Space Used (GB)
- Disk Space Available (GB)
- Perfmon Counters.
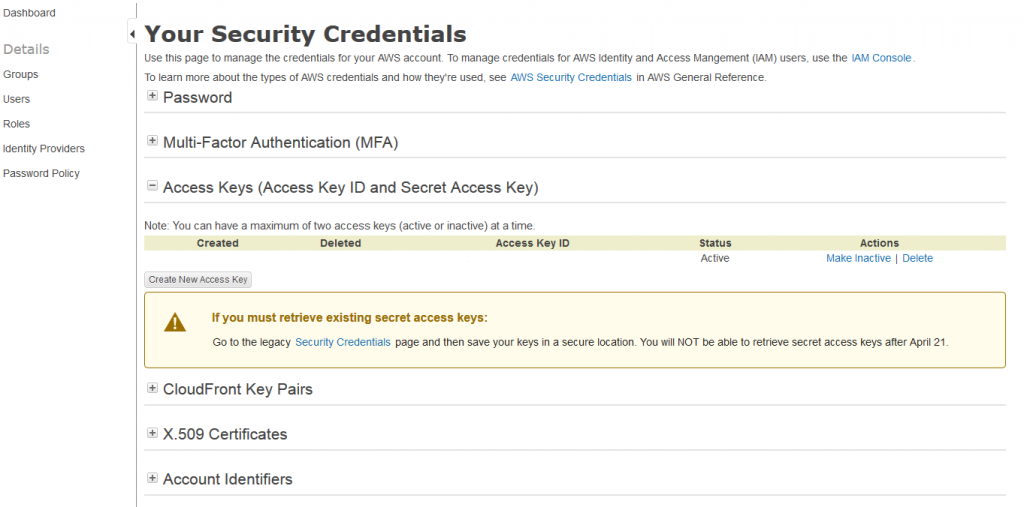
Amazon Access Key ID and Secret Access Key
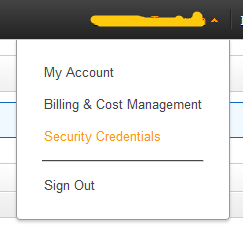
To run those scripts, you will probably need to provide the access key and it wasn’t that straight forward to find your own secret access key on Amazon so I captured the screenshots of navigation.
Bugs in Amazon CloudWatch Monitoring Scripts
You will get the following error when you try to load the Amazon powershell module.
Error Screenshot
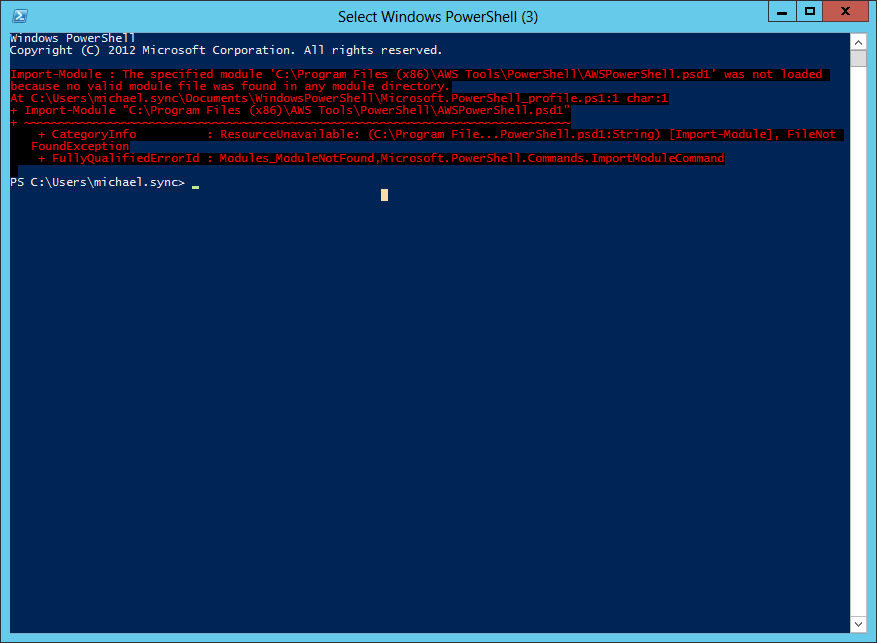
Error Message in text (for Google. of course! )
Windows PowerShell
Copyright (C) 2012 Microsoft Corporation. All rights reserved.
Import-Module : The specified module ‘C:\Program Files (x86)\AWS Tools\PowerShell\AWSPowerShell.psd1' was not loaded
because no valid module file was found in any module directory.
At C:\Users\michael.sync\Documents\WindowsPowerShell\Microsoft.PowerShell_profile.ps1:1 char:1
Import-Module “C:\Program Files (x86)\AWS Tools\PowerShell\AWSPowerShell.psd1”
CategoryInfo : ResourceUnavailable: (C:\Program File…PowerShell.psd1:String) [Import-Module], FileNot
FoundException v
- FullyQualifiedErrorId : Modules_ModuleNotFound,Microsoft.PowerShell.Commands.ImportModuleCommand
PS C:\Users\michael.sync>
Solution
This issue occurs because of the wrong path in powershell profile. Look the screenshot below for the file name and its location and you can fix the path.
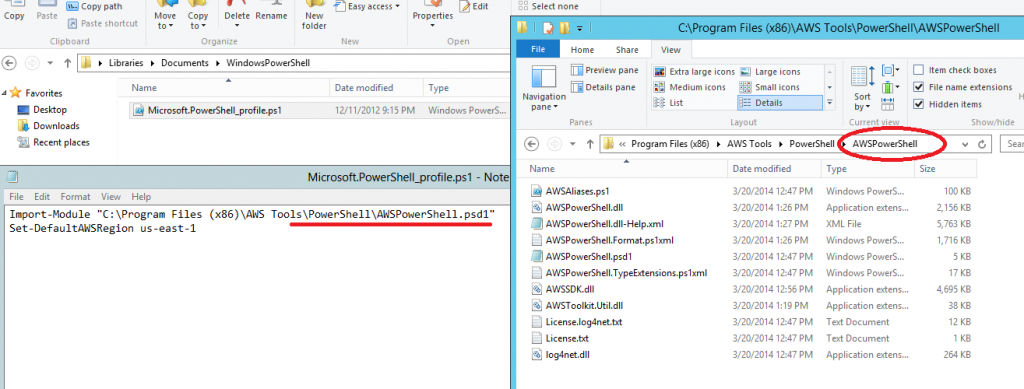
Note: $env:psmodulePath is the automatic variable which holds the path used to discover modules. If it’s not set, PowerShell looks in C:\windows\system32\WindowsPowerShell\1.0\modules and MyDocuments\WindowsPowerShell\modules
After fixing the wrong, you should be able to run any script from “Amazon monitoring scripts”.
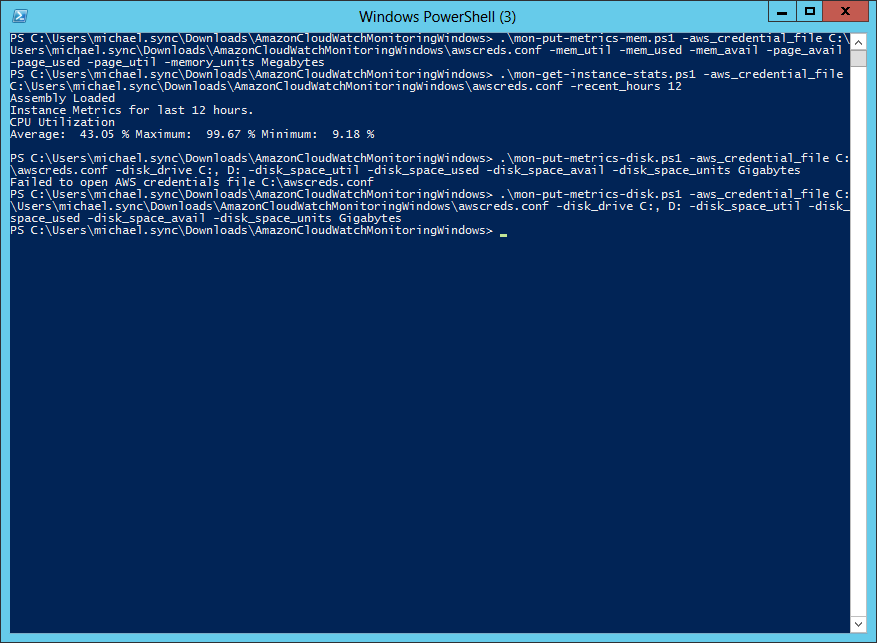
if you can manage to run the scripts that you requires the metrics to be appeared then you can trigger those scripts from windows scheduler every 5 mins or so.
And then you will see new custom metrics as below in CloudWatch dashboard. You can go ahead and create some alerts on new custom metric.

Here is the scripts that I am using for monitoring the memory utilization and disk space.
| |
OK. I know! It’s not very simple so let’s take a look at third-party stuffs.
New Relic

We chose New Relic because they officially supports monitoring for EC2 instance in very simple way.
Installers for New Relic - Servers
All you need is to download the installer and install it on your VM. That’s it!
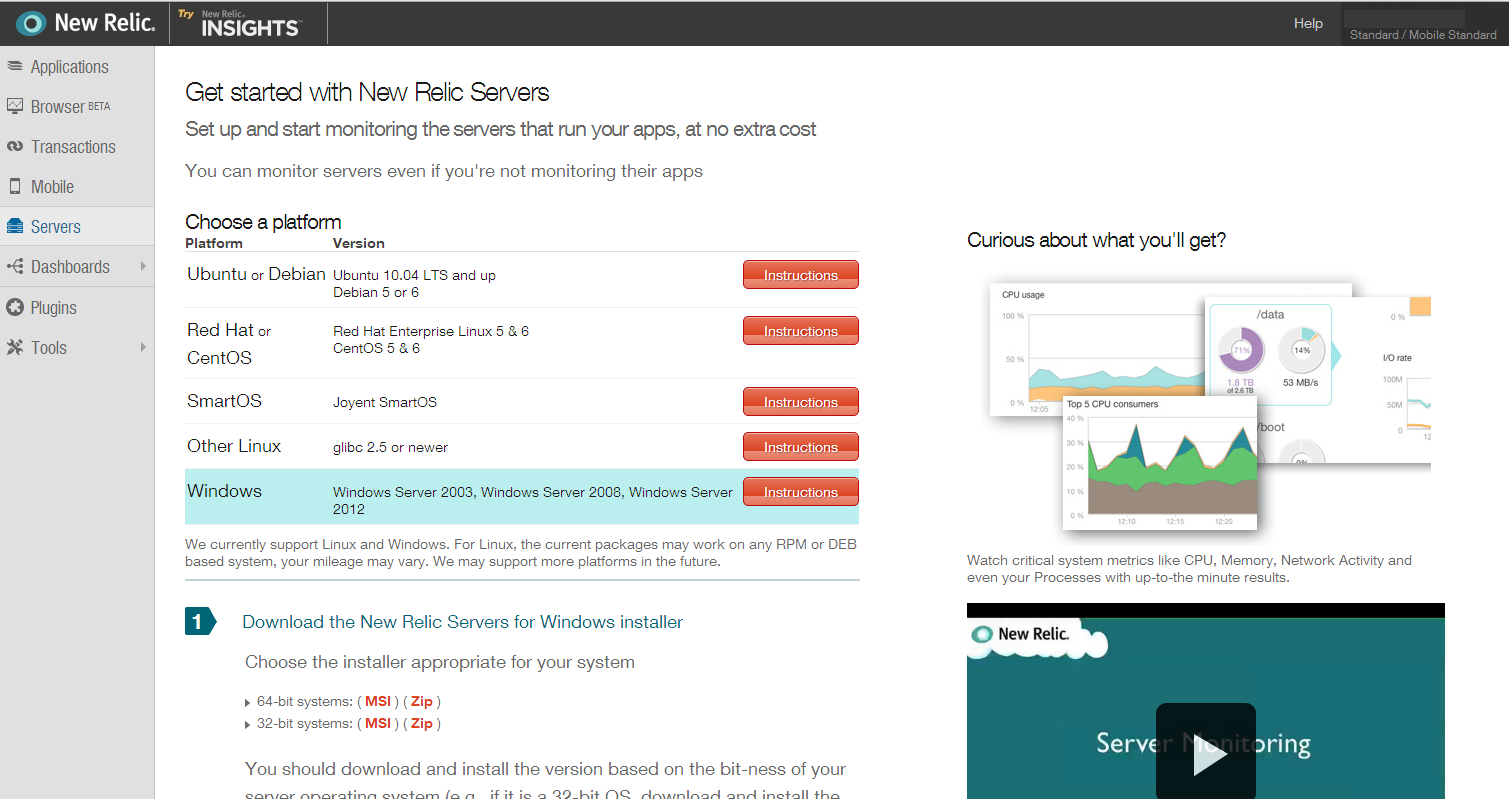
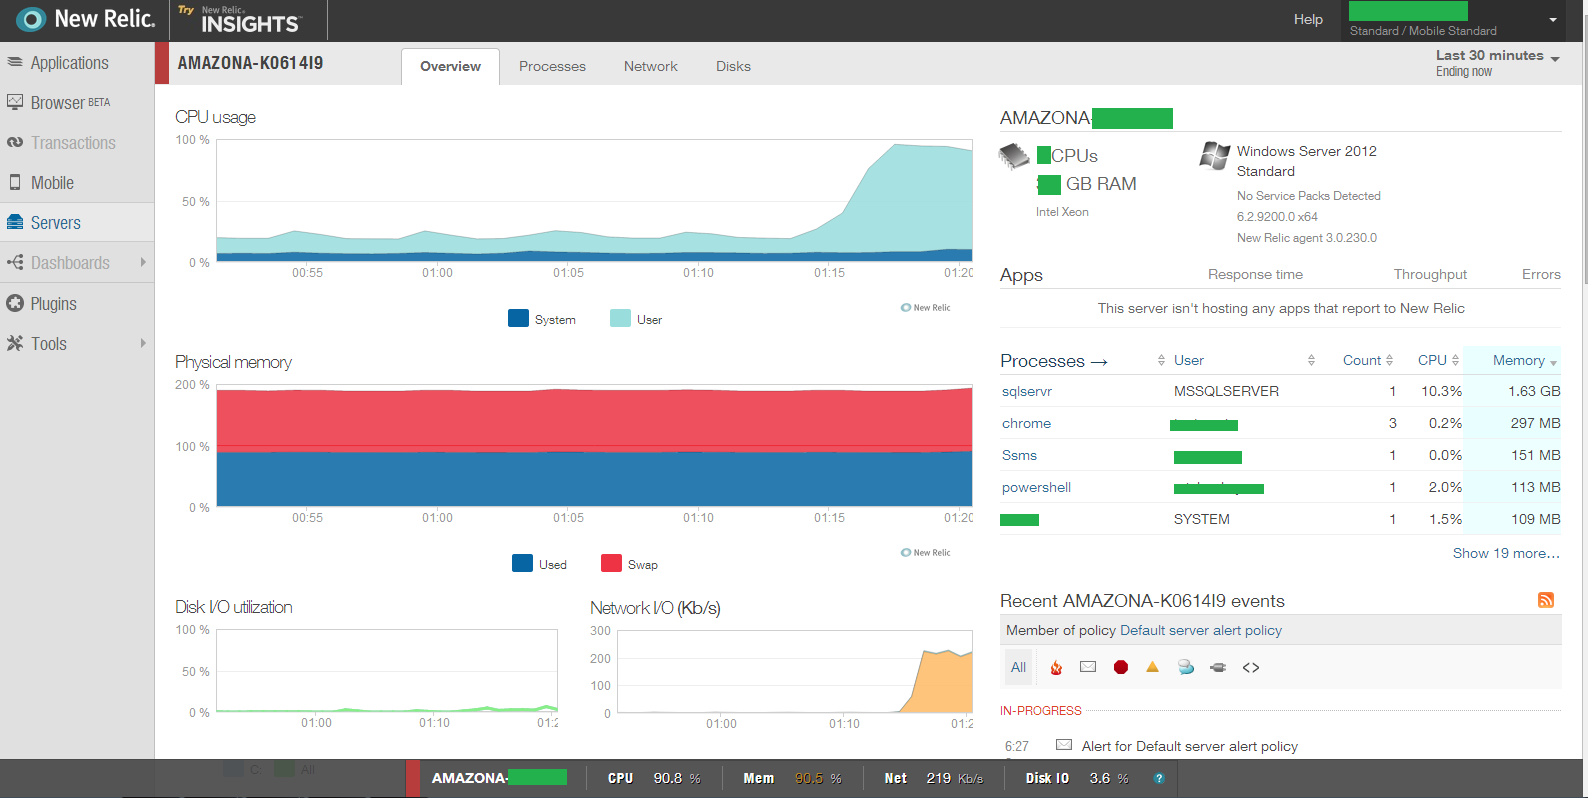
You will get the following dashboard after installing the New Relic installer on your server.
Plugins - New Relic
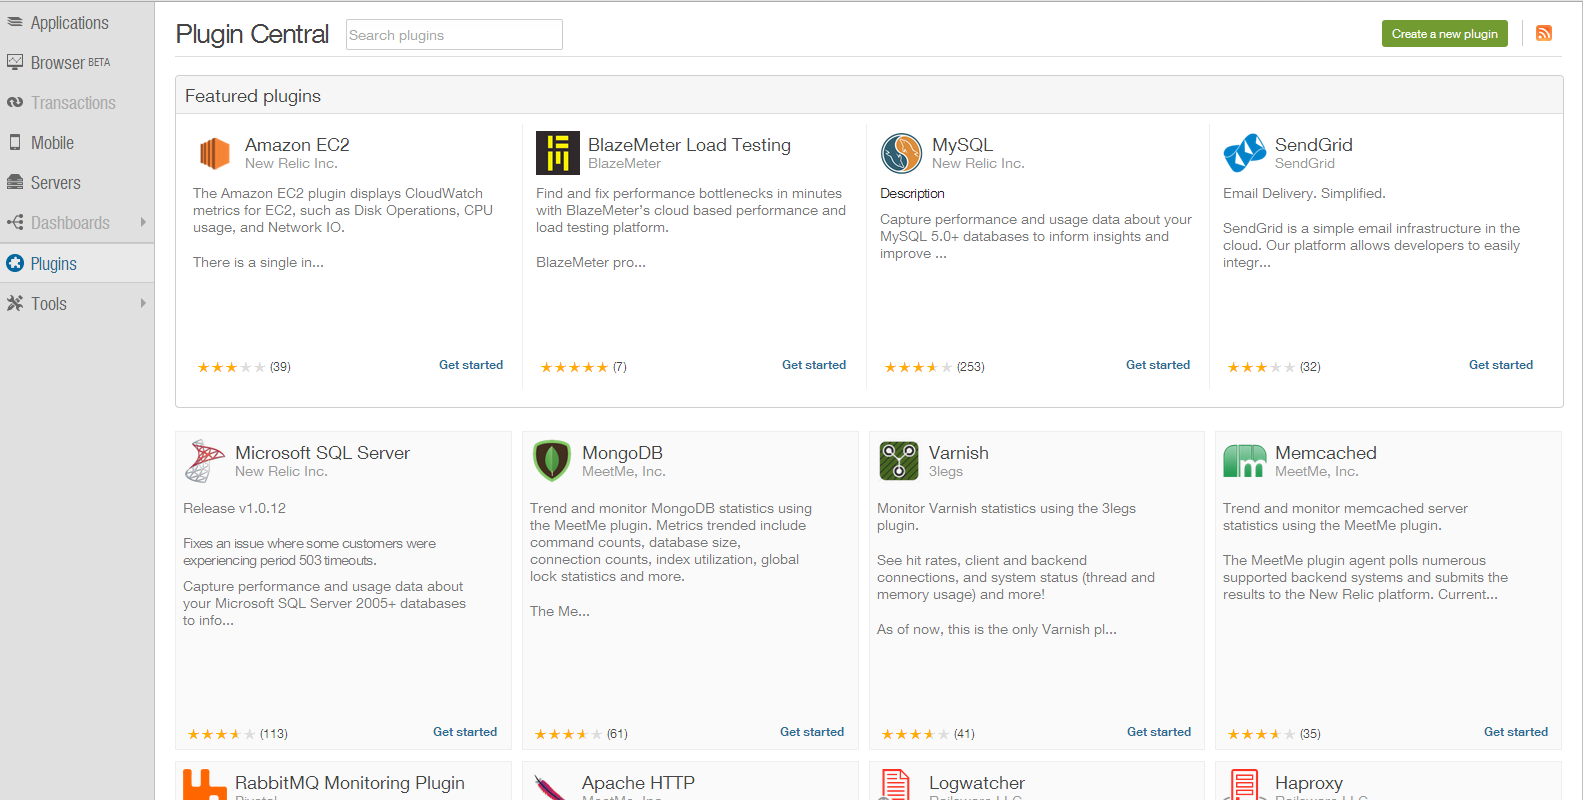
If you are not happy with default monitoring, you can look at thousands of plugins in “plugin central” or you can even create it on your own. (Note: We didn’t use “Amazon EC2” plugin until now but we are planning to test it in a few weeks time.)
Look cool and simple? Yes! it is.
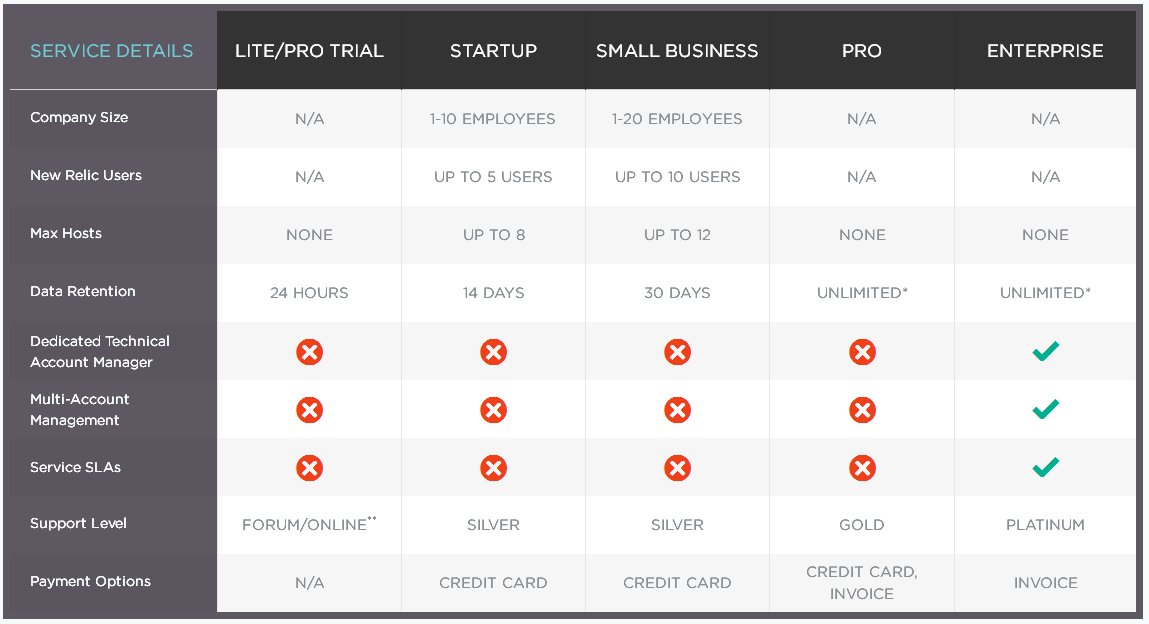
New Relic has a few different plan that you can choose. As of now, we are using LIFE (a.k.a. Standard) version so we have only 24 hours for data retention. You can look at their prices in this link for details.
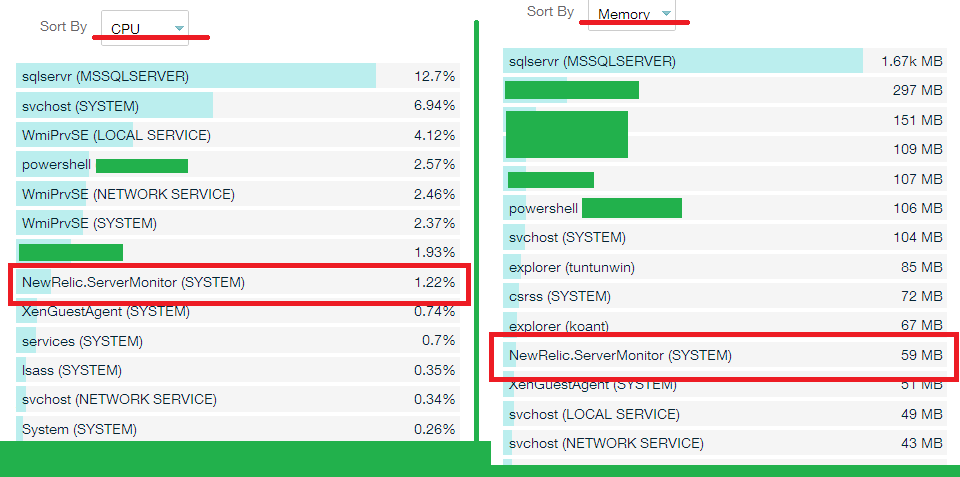
Last question. Is New Relic service expensive for server?
Here is what we found and I think it seems pretty okay.
Are you a EC2, Cloud Watch or New Relic user and got a tip to share? please feel free to drop a comment here. Thanks!
